Realized LTV per new user
Learn what the Realized LTV per new user chart measures and when to use it.
What it shows
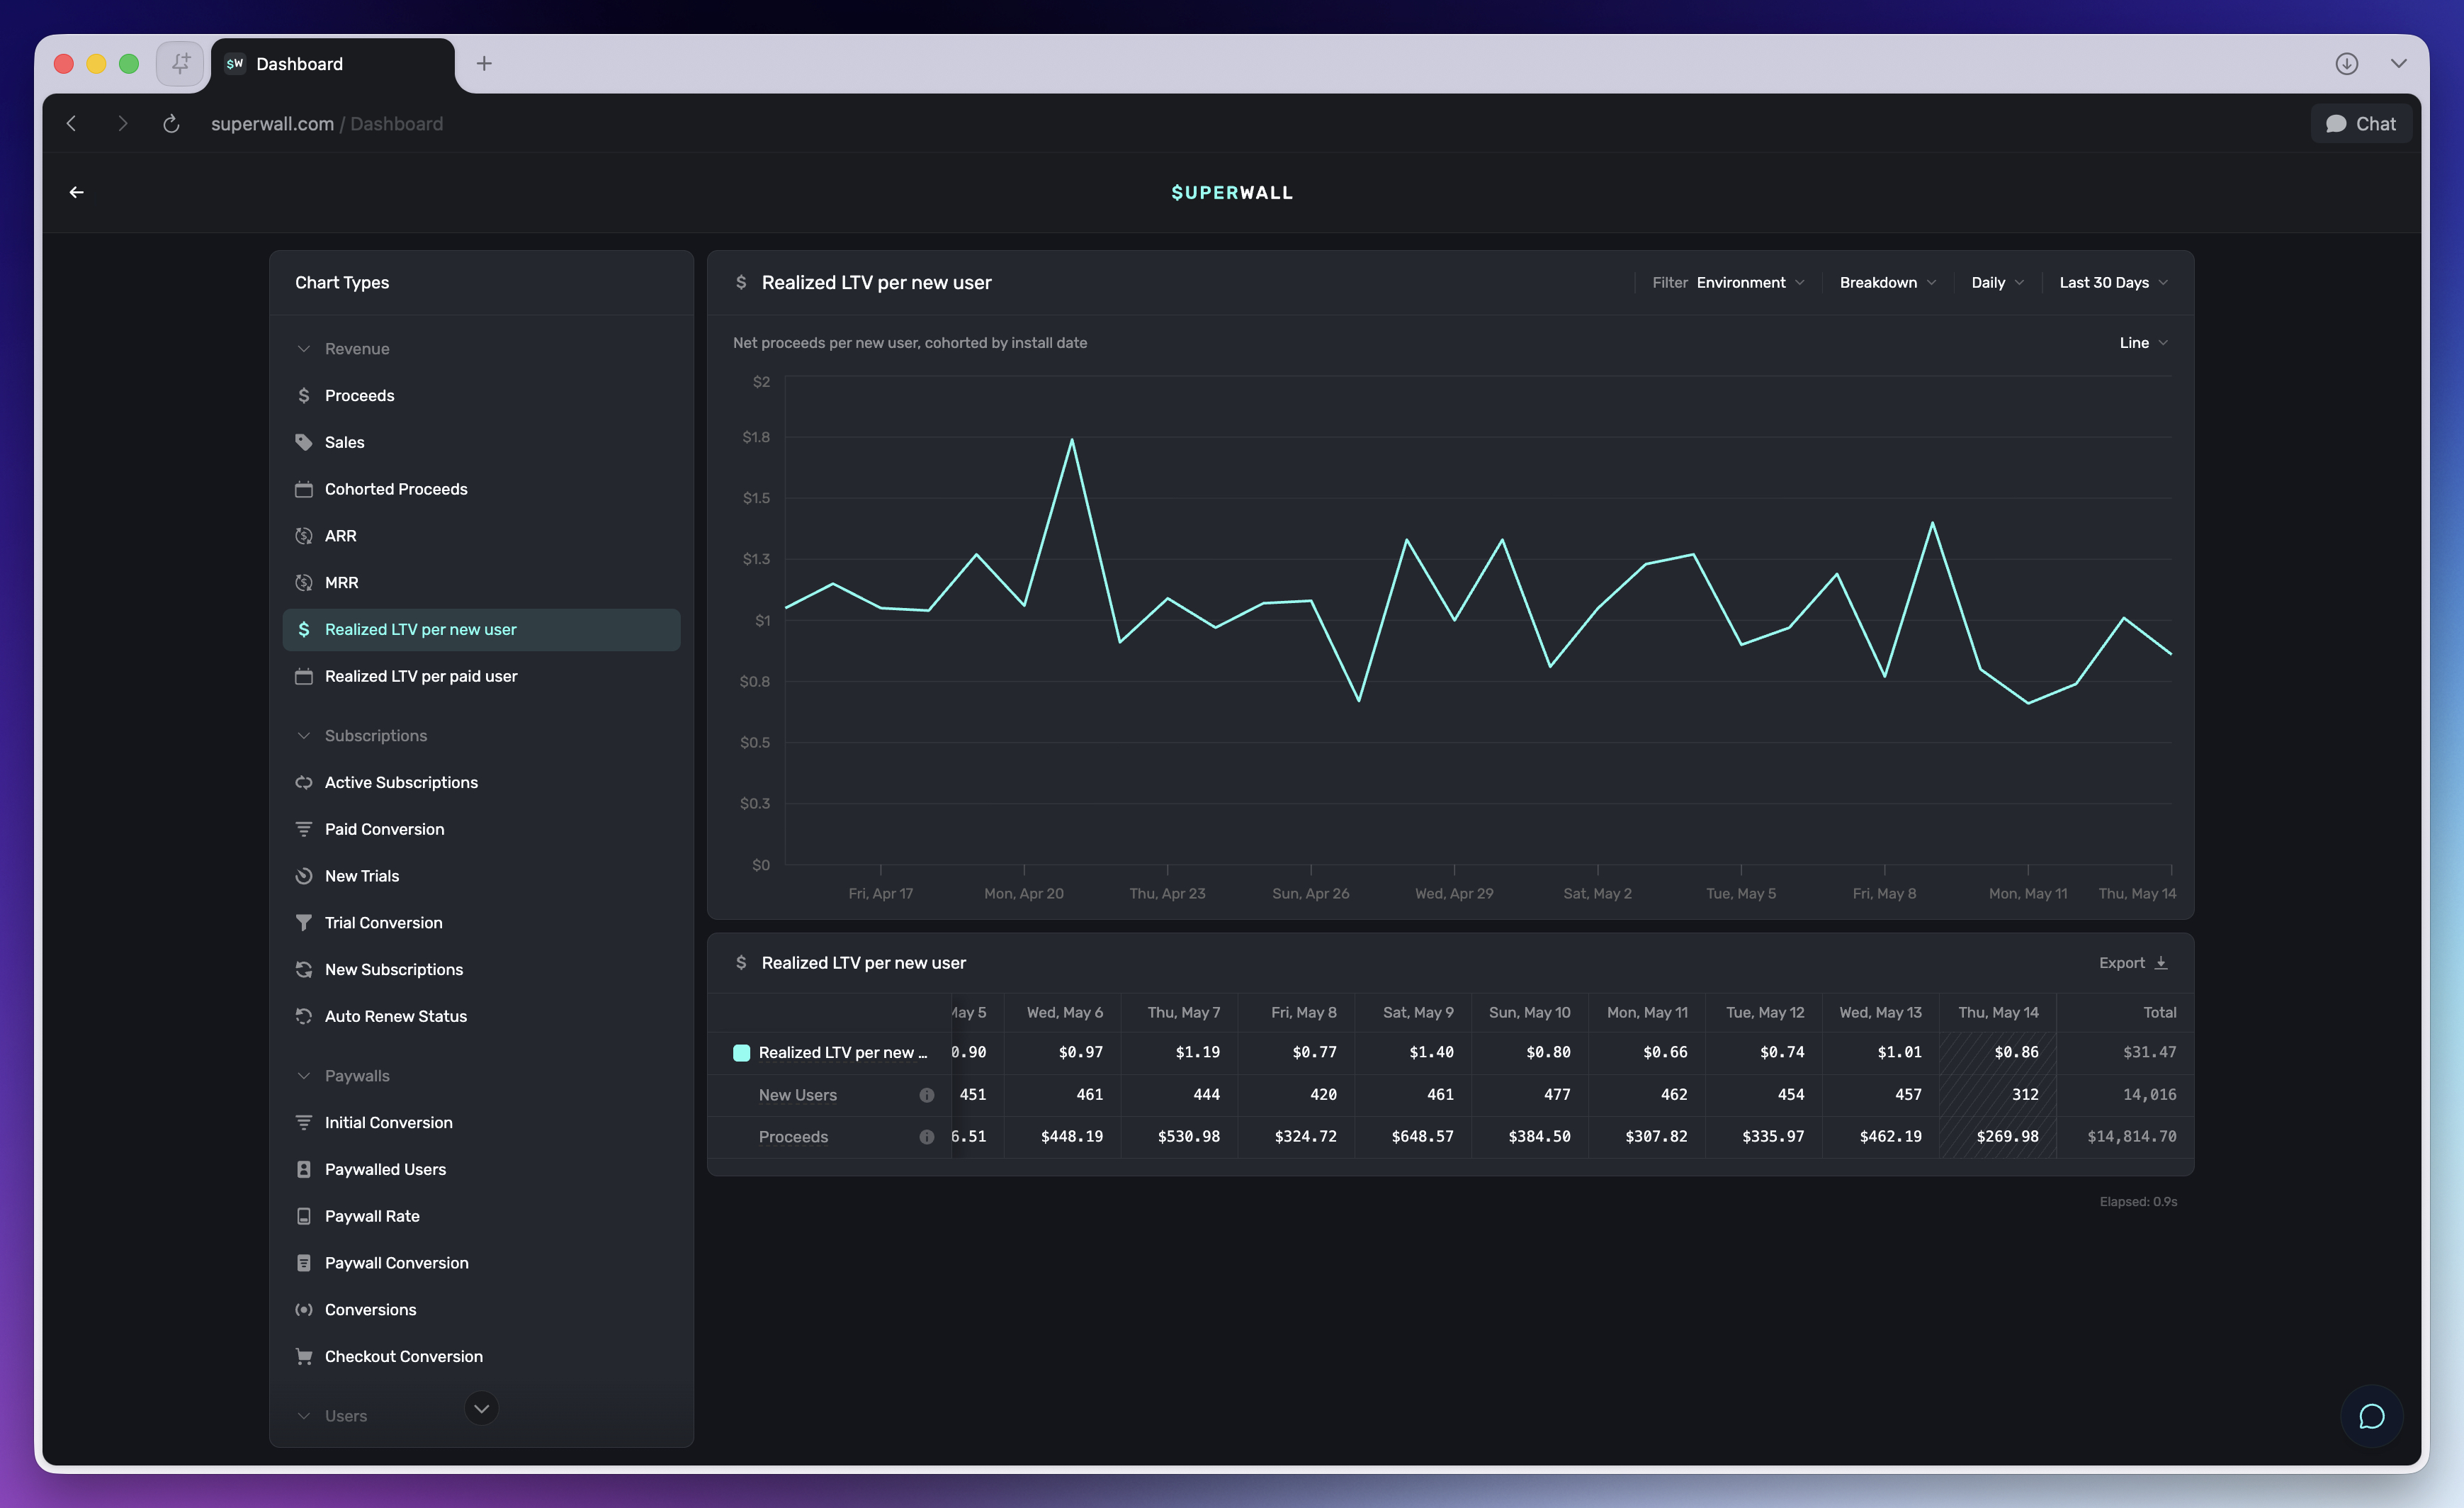
Realized LTV per new user shows net proceeds per new user, cohorted by install date.
How to use it
Use this chart to understand how much revenue new users have actually generated so far. It is useful for evaluating acquisition quality, pricing changes, and onboarding or paywall changes across install cohorts.
Choosing a window
The Window control is available in Dashboard v2. Enable New Dashboard Experience from
Settings > Public Beta, then open the chart at app.superwall.com. The legacy dashboard at
superwall.com does not show this control, and its version of the chart is always unbounded.
By default, this chart counts every dollar a cohort has ever earned, no matter how long after install it came in. The Window control caps that, counting only what a user spent within a set number of days of installing.
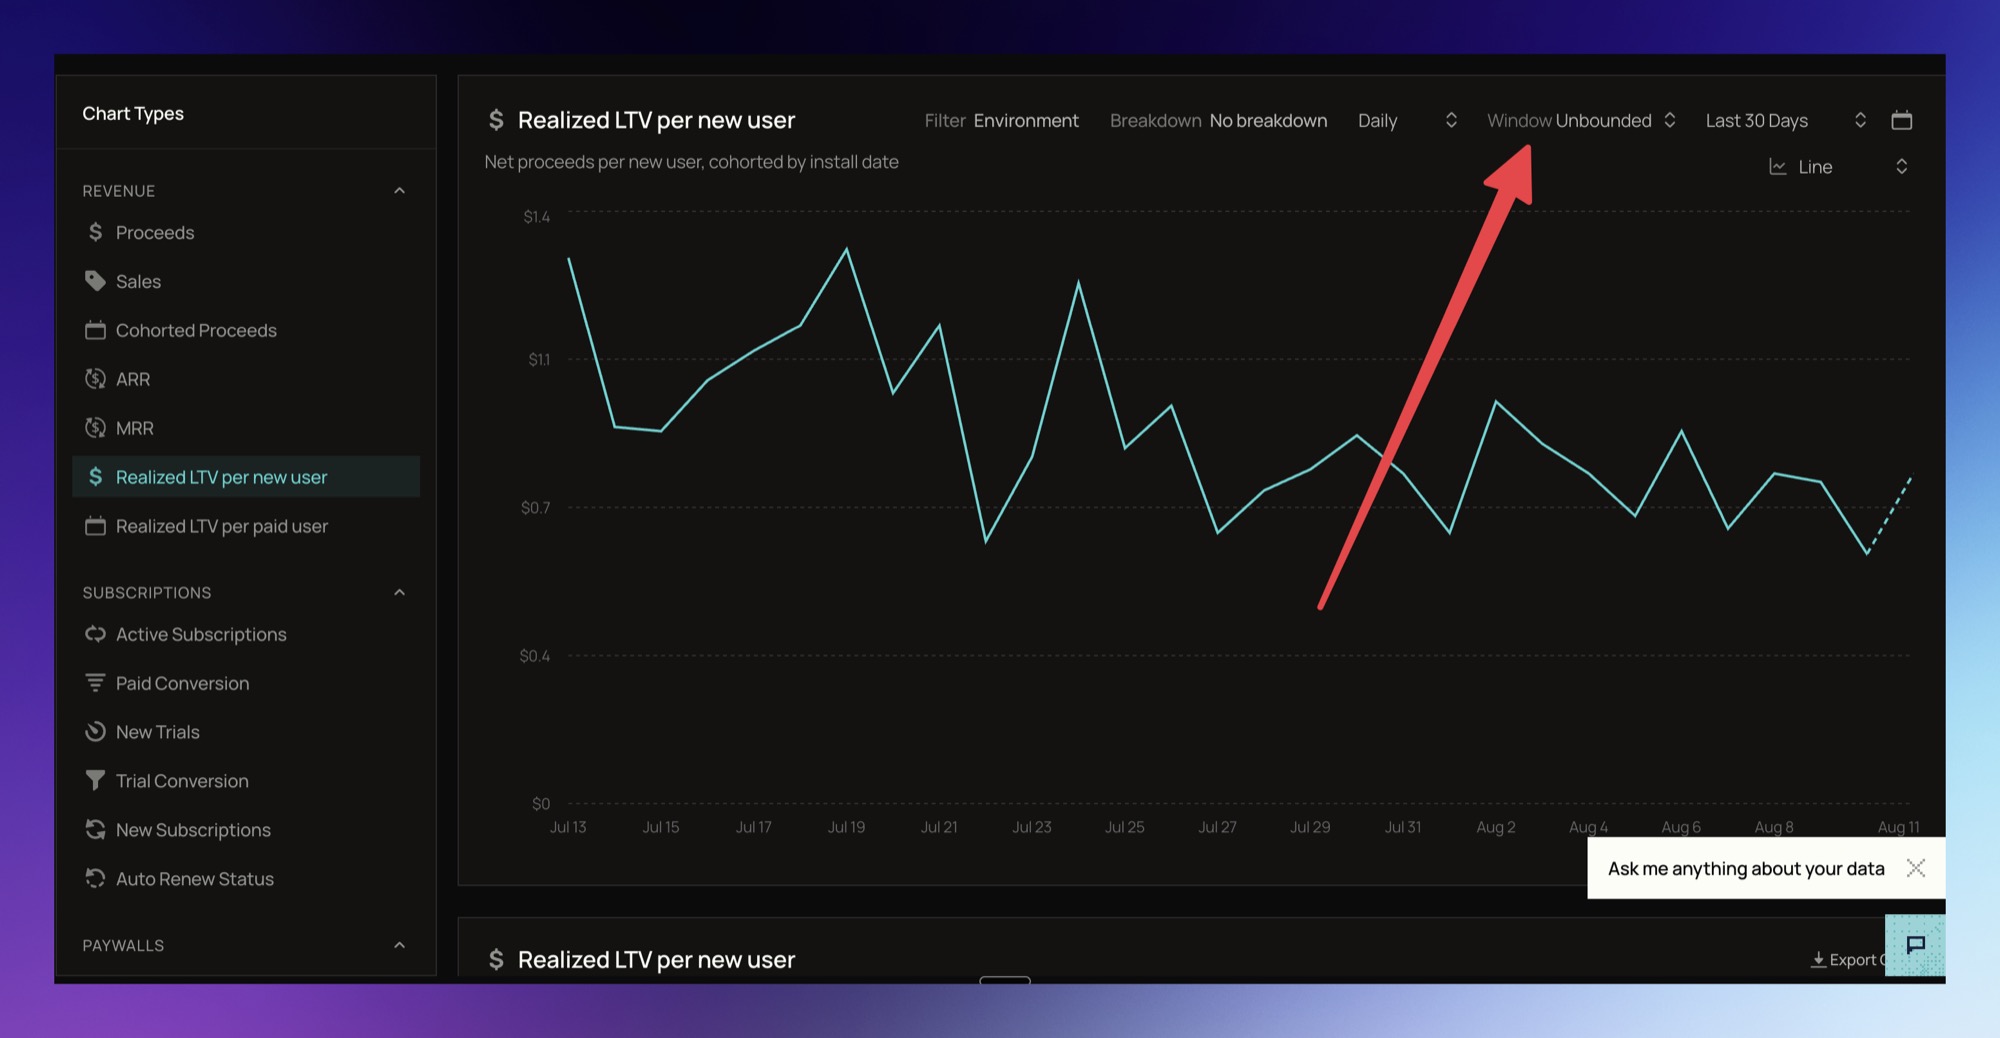
Choose from 3 days, 7 days, 14 days, 30 days, 90 days, or Unbounded. Unbounded is the default, and matches how this chart has always behaved.
The window runs from each user's install date, not from the chart's date range. Pick 7 days and someone who installed in March and someone who installed last week are both measured over their first week.
Without a window, older cohorts almost always look better, because they have had more time to earn. That makes it hard to tell whether a pricing or paywall change actually worked. Set a window and every cohort gets the same number of days.
Short windows show how fast a cohort starts paying back. Longer ones pick up renewals and trials that convert late.
Good to know
Newer cohorts have had less time to generate revenue. Set a Window to compare them fairly, or keep the gap in mind when reading the chart unbounded.
Cohorts too recent to have filled the window are marked incomplete. On a daily chart with a 7-day window, that is today plus the previous seven days, and those points will keep rising. The marking follows the chart's display interval, so a weekly or monthly view marks whole weeks or months.
The Window control appears only on this chart. Realized LTV per paid user and the other revenue charts are always unbounded.
Any window other than Unbounded is calculated fresh instead of served from cache, so it takes a bit longer to load.
How is this guide?